

Objective
Create a new site for Boston Ballet that captures the energy of the institution and increases ticket sales.
Research
This project was unique because the RFP we received to start the project was very robust and had included significant research as well as personas. While helpful in some ways, it gave us the constraint of a smaller research budget. We also had to make sure that the information provided was still relevant and useful.
To understand the marketplace, we conducted a competitive analysis of not only the world's leading Ballet organizations but also for leading consumer products and services like Airbnb.
To understand the nuances of how the organization worked, I worked with our strategists to craft a survey. Getting to understand the aspirations and pain-points across the departmental silos of an organization brought tremendous insight. It also made our discovery workshop more productive because we weren't starting cold.


Discovery findings and site concept
Our research and discussions with various stakeholders, we noticed four themes that made up our shared understanding of the problem we had to solve. This would lead to our "Site Concept", our north star that would inform all subsequent design decisions.


Site map and selected user flows
This relatively simple site map was the result of many hours of sketches, discussions and client presentations. The previous structure was very sprawling in an attempt to represent the needs of various departments. Our solution did made this possible in a more elegant and user-focused manner.


This is the initial flow for the ticket purchasing experience. We partnered with a third party vendor that managed all of Boston Ballet's CRM needs. We tried to illustrate the ideal user experience and where our CMS handed the user over into their tools.
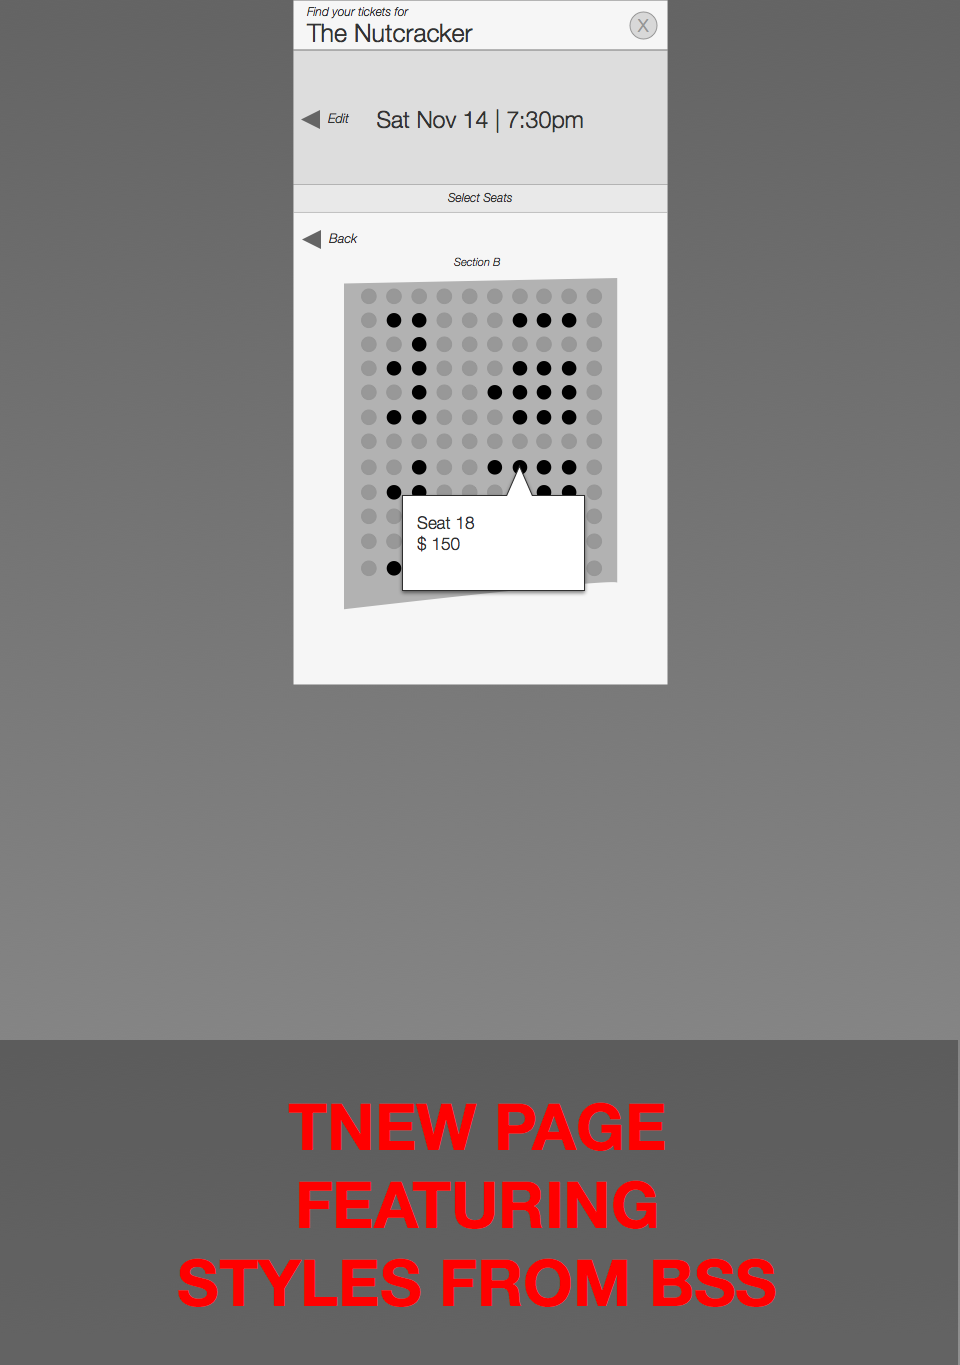
Wireframes


Process documents
I love making experience maps and understand the big picture of the problem I'm trying to solve. To help our clients understand how to best partner with us, I decided to make them an experience map for the deliverables in each phase of the project. This would help everyone understand the goals behind each deliverable and how it related to the larger flow. This document below was pinned to the wall in their office as we worked together.

Impact
Bounce Rate decreased 16.75%
Average session duration increased 12%
Online single ticket purchases increased 13%
Online contributions have increased approximately 79%